What is Data Analytics? Data Analytics Defined + Infographic
As with many terms in the data world, there is not a standard, authoritative definition for Data Analytics. There is overlap between analytics and other similar data-related concepts (like Data Science, Data Analysis, Business Intelligence, Data Visualization, etc.)… but where does one end and the other begin?
Well, in this post, we draw a line in the sand. This website is all about data analytics, so we might as well advance our definition of it. In so doing, you will see how we define Data Analysis, and how it incorporates two important fields: Data Analysis and Data Visualization.
Data Analytics Defined
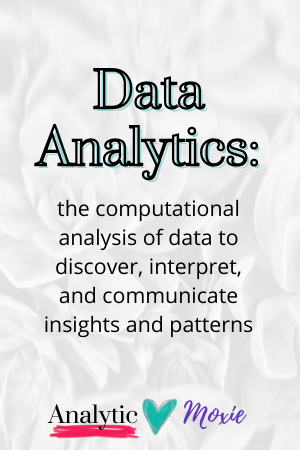
According to the Oxford English dictionary, analytics (as an area of inquiry) is “the systematic computational analysis of data or statistics”. We extend this definition a bit to note its use: to discover, interpret, and communicate insights and patterns found in data.
It seems simple – perhaps even a bit generic. But it gets a little more complicated when you try to tease out how it differs from other concepts, like Data Analysis or Data Science. Let’s explore a bit further.
Data Analytics vs Data Analysis
It is not uncommon for folks to use the terms data analytics and data analysis as substitutes for each other. I frequently do this myself, and (luckily) no one really calls me out on it 😊.
But, one thing my mother always told me when learning vocabulary in school was this: you can’t use the term to define itself. Applied here, this means that the definition of Data Analysis cannot be ‘the systematic computational analysis of data…’ as it is for Data Analytics.
We define Data Analysis as the process of inspecting, cleaning, transforming, and modeling data.
Indeed, data analysis and data analytics are closely related, but there is clearly some nuance. Data analytics encompasses a field, whereas data analysis is a process.
To take it a step further, I would argue that data analysis is the process that underlies data analytics. I’ll draw this out in the infographic below, but it makes sense to explain a bit more.
Data Analysis Process
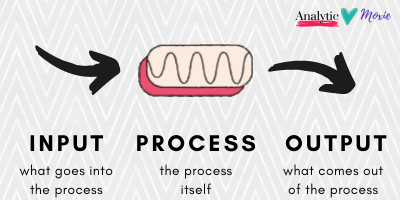
Data Analysis is a process. When explaining the process, many folks choose to focus on the steps that make up a data analysis (Inspecting, Cleaning, Transforming and Modeling), but frequently forget that a process necessarily has inputs and outputs.
The input to the Data Analysis Process is – you guessed it – DATA! The data undergoes analysis, and the output is insight and newly discovered patterns.
The data analysis process itself is quite involved. For now, we will introduce each step, but will cover them at length in future posts.
- Inspecting Data involves getting a clear understanding of and exploring the data, its sources and initial quality
- Cleaning Data is the action of improving data quality using a variety of techniques
- Transforming Data is concerned with creating features and reshaping the underlying data into something new and useful
- Modeling Data entails strategically applying and comparing algorithms, functions and curiosities to search for meaningful insights in the data
Communicating through Data Visualization
Finally, we are introduced to another important part of analytics, and that is the communication piece. We use Data Visualization as a means to communicate the insights that we find in our data. A thoughtful approach to Data Visualization in which you weave together a narrative is called ‘telling a story with data’.
And What About Data Analytics Tools?
There are a number of tools and technologies that are used in Data Analytics. Some popular tools like Excel, Microsoft PowerBI and Tableau are used to describe Analytics themselves. Programming languages like Python and R have nicely developed packages to enable analytics as well.
When thinking about getting into Data Analytics, many people first think of the technologies that need to be learned. I think that this is a mistake. It is important to first understand the foundations, and focus on critical thinking and problem solving. While the tools are important and have their place, they ultimately serve to make the critical thinker more efficient at processing data to solve a problem.
Data Analytics Roles
One final point that we will discuss is that of common roles associated with Data Analytics. These are not mutually exclusive roles. In actuality, depending on the organization, you may have entire teams performing pieces of one function (typically at larger organizations), or one person that is a jack-of-all-trades (typically at a smaller organization).
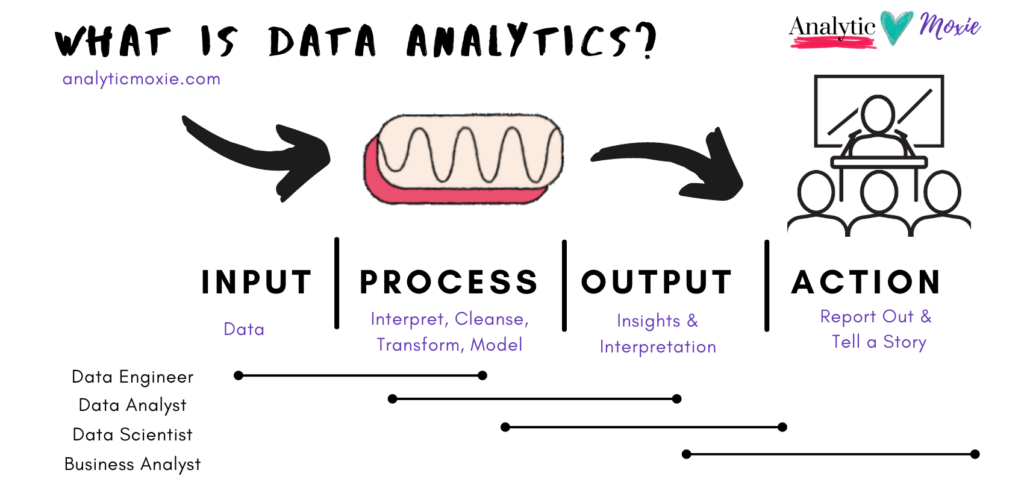
- Data Engineer: a role that is primarily responsible for provisioning the platforms used to house data. They will also be involved in the process of migrating data, and may assist with extracting data from systems as well.
- Data Analyst: a role that is primarily responsible for the data analysis process – namely interpreting, cleansing, transforming and modeling data. In some organizations an analyst is a more junior level role when compared to a data scientist and may have fewer modeling responsibilities. This, however, is not always the case.
- Data Scientist: a role that is engaged in the entire life-cycle of data but that is typically a more senior role with responsibility for modeling (sometimes creating algorithms), comparing models, and interpreting model outputs to provide insights
- Business Analyst: a role that is close to the business that works to interpret data and tell a story
Data Analytics Infographic
Below is our infographic that attempts to pull all of these pieces together. Reflect on our definition of Data Analytics to see if you can identify each piece.
This is a unique take on data analytics, so let us know what you think!



Leave a Reply